How’s the Austin Real Estate Market?
Our clients ask us this question often. They know the real estate market can change quickly, in response to interest rates or changes in employment. Builder homes may come on the market in new subdivisions, or remodels, flips, and tear-downs can appear in older neighborhoods. Our clients want an update on the balance between supply and demand in today’s real estate market.
To help us give them an accurate response, we look at the number of homes sold per month over the past year – the sales rate. The sales rate is then divided into the number of homes available to be sold. The result is the “months of inventory” on the market.
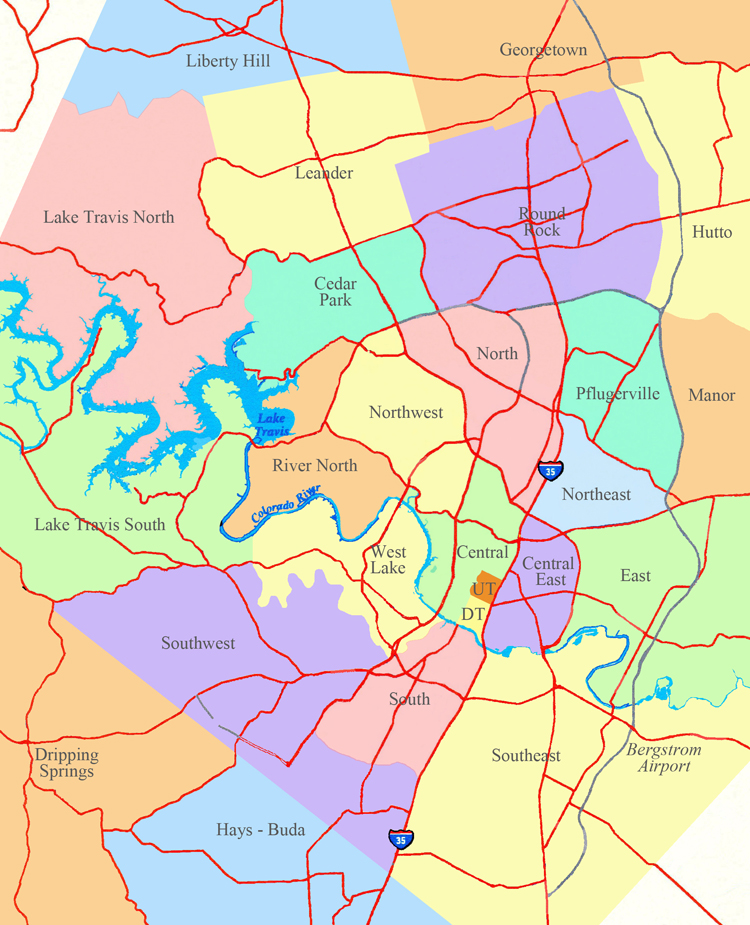
This is a key indication of the market. About 6.5 months of inventory is a balanced market. The bottom line is: Austin real estate market continues to operate at a 2.8 month level of inventory. This is less than half the inventory required for a balanced market. So, overall, we have a seller’s market. However, there can be variation in the market depending on the area and price range. See below for a closer look at each area.
If you’d like to own a piece of increasingly valuable Austin real estate, give us a call! We have over 30 years experience in Austin real estate and study the market constantly.
Austin Real Estate Market – Month of Inventory by Areas:
Area |
Months
|
Sales
|
Westlake |
||
| Under $800,000 | 2.04 | 247 |
| Over $800,000 | 5.50 | 275 |
Central |
||
| Under $800,000 | 2.0 | 874 |
| Over $800,000 | 5.0 | 188 |
Northwest |
||
| Under $800,000 | 1.35 | 1351 |
| Over $800,000 | 3.28 | 55 |
Central East |
||
| Under $800,000 | 2.5 | 955 |
| Over $800,000 | N/A | N/A |
River North |
||
| Under $800,000 | 2.96 | 409 |
| Over $800,000 | 5.95 | 109 |
South |
||
| Under $800,000 | 1.49 | 1352 |
| Over $800,000 | 6.7 | 86 |
Southwest |
||
| Under $800,000 | 1.60 | 1720 |
| Over $800,000 | 9.19 | 77 |
Southeast |
||
| Under $800,000 | 2.18 | 814 |
| Over $800,000 | N/A | N/A |
Lake Travis South |
||
| Under $800,000 | 3.82 | 1131 |
| Over $800,000 | 15.65 | 164 |
North |
||
| Under $800,000 | 1.18 | 602 |
| Over $800,000 | N/A | N/A |
Northeast |
||
| Under $800,000 | 1.00 | 409 |
| Over $800,000 | N/A | N/A |
Round Rock |
||
| Under $800,000 | 1.42 | 3026 |
| Over $800,000 | N/A | N/A |
Cedar Park |
||
| Under $800,000 | 2.07 | 2846 |
| Over $800,000 | N/A | N/A |
Pflugerville |
||
| Under $800,000 | 1.60 | 1866 |
| Over $800,000 | N/A | N/A |
Additional Market Context:
On the supply side, new home inventory has risen by 11%–builders are getting into the market.
On the demand side, pending sales are up by 9%, and sales volume is up by 13% over this time last year.
Overall, the Austin real estate market is active and has strong demand. Austin has the 2nd most stable housing market in the country, according Freddie Mac, trailing only Fresno, CA.
- 2,603 – Single-family homes sold, seven percent more than September 2014.
- $258,000 – Median price for single-family homes, eight percent more than September 2014.
- $324,150 – Average price for single-family homes, five percent more than September 2014.
- 47 – Average number of days single-family homes spent on the market, three more days than September 2014.
- 2,860 – New single-family home listings on the market, 11 percent more than September 2014.
- 6,759 – Active single-family home listings on the market, four percent more than September 2014.
- 2,391 – Pending sales for single-family homes, nine percent more than September 2014.
- 2.8 – Months of inventory* of single-family homes, unchanged from September 2014.
- $843,762,450 – Total dollar volume of single-family properties sold, 13 percent more than September 2014.
Austin Area Map:


